When Personalization Starts to Feel Like Surveillance
——This is not about rejecting personalization. It is about rejecting personalization without trust.
By Henry Lawson | Updated on May 31, 2026 | 🕓 11 minutes
Key Highlights
- What is the hidden “trust tax” behind different personalization layers?
- Why do some personalized recommendations feel useful while others feel invasive?
- How can brands improve personalization without triggering the “creepy” effect?
- How can businesses measure trust loss caused by personalization strategies?
- What practical steps can brands take to reduce customer resistance to AI-driven recommendations?
A Dutch independent e-commerce operator named Maya shared her story: at two in the morning, she received an email recommending a yoga mat. The recommendation was disturbingly accurate — she had just discussed yoga mats with a friend over a voice call that afternoon, yet she had never searched for one on any device.
Maya’s first reaction was not, “Wow, the algorithm is impressive.”
It was: “How do they know this?”
Ironically, Maya herself worked in marketing. Just one week earlier, she had deployed a new “smart recommendation layer” on her own website. In that moment, she realized something unsettling: she had become the victim of her own strategy.
This is not an isolated case. In a Gartner survey released in June 2025 covering 1,464 B2B buyers and consumers across North America, the United Kingdom, Australia, and New Zealand, 53% of respondents said personalization negatively affected their most recent purchasing journey. These consumers were 3.2 times more likely to regret their purchase and 44% less likely to buy from the same brand again. At the same time, they also admitted that personalization made them 1.8 times more willing to pay a premium.
That is the paradox: personalization can generate revenue, but it can also destroy trust. The difference lies in which layer you add.
We obsess over the ROI of personalization, yet we rarely apply the same rigor to calculating the erosion of trust.
I. The Core Problem Is Not “Personalization vs. Privacy” — It Is “Trusted Personalization” vs. “Trustless Personalization”
Consumers are not against personalization.
A CapTech survey conducted in August 2025 among 447 U.S. consumers found that shoppers were 40% more likely to purchase from brands that offered personalized experiences. What they oppose is black-box personalization — the kind of “precision” where companies cannot clearly explain where the data came from or why the recommendation appeared.
There is also an academic finding that the marketing industry has long underestimated. A mixed-method study published in the Journal of Retailing used stratified random sampling on 400 active online shoppers from Amazon, Flipkart, and Alibaba platforms (95% confidence level, ±5% margin of error). The research found that:
The direct effect coefficient of personalization quality on customer loyalty was 0.65. However, once “trust” was introduced as a mediating variable, that coefficient dropped sharply to 0.38, while trust itself showed predictive power as high as 0.52.
What does that mean?
Personalization itself does not create loyalty. Trust does.
Personalization is merely the vehicle through which trust is delivered. Remove trust, and even the most sophisticated algorithm becomes an expensive centrifuge — the faster it spins, the farther customers fly away.
Another frequently cited dataset comes from an InMoment study in 2018:
75% of consumers felt that most personalization was “at least somewhat creepy.”
22% abandoned brands after being “spooked,” and 20% spread negative word-of-mouth within their social circles.
These numbers have not improved in 2025. If anything, the rise of AI has intensified the problem.
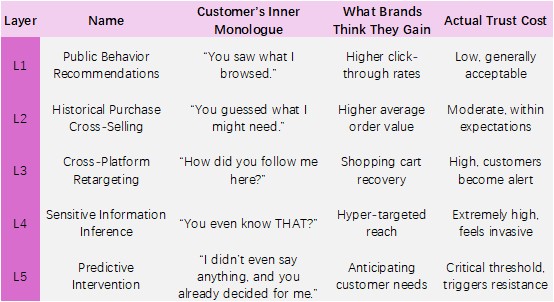
II. The Five Layers of Personalization — and Their Corresponding “Trust Tax Rates”
I divide common personalization tactics into five layers. Every additional layer, if implemented without transparency, effectively taxes the customer’s “trust account.”
This framework is based on my observations over the past five years across multiple industries — from European DTC e-commerce brands to Southeast Asian fintech companies. It is not a textbook classification, but it is highly practical and easy to map onto your own business.
A Gartner survey conducted in 2019 among more than 2,500 consumers found that 38% of consumers would completely stop engaging with a brand if personalization felt “creepy,” while more than half would unsubscribe altogether.
Meanwhile, the Thales 2025 Digital Trust Index — a large-scale study involving 14,009 respondents across 14 countries — reported that:
82% of consumers abandoned a brand in the past 12 months due to concerns about how their personal data was being used.
Combining these findings, I propose a management warning benchmark:
For every additional non-transparent personalization layer, the marginal risk of losing loyal customers rises by roughly 10%–15%.
I use the midpoint — 12% — not to create fear, but to provide a way of accounting for trust as a measurable business cost.
Think of it like corporate taxation. The burden is not paid all at once; it compounds layer by layer as operations expand. If your business simultaneously runs L3 cross-site tracking, L4 sensitive inference, and L5 predictive intervention, the compounded churn risk could approach 30% — and that is before accounting for the multiplier effect of negative word-of-mouth.
III. Who Is Paying the Tax — and Who Is Getting a Refund? Three Imperfect Real-World Cases
Case 1: Spotify’s “Why Am I Seeing This?” Button (Trust Refund)
Spotify added a simple “Why am I seeing this?” button to its recommendation interface. When users clicked it, the system explained:
“Because you recently listened to X, and this track shares similar audio characteristics.”
This was not groundbreaking technology, but it cracked open the black box just enough for users to feel respected rather than targeted.
The interesting part is this:
Spotify did not achieve dramatically higher click-through rates because of the feature, but measurable improvements appeared in long-term retention.
This is a case of “trust compounding” — where the payoff is not immediate, but accumulates over time.
More importantly, Spotify’s recommendation system primarily operates using L1 and L2 data layers (songs listened to, playlists created). The company deliberately avoids drifting too deeply into the gray territory of L3 and beyond.
That is not a technical limitation. It is a product philosophy.
Case 2: Target’s Pregnancy Prediction Incident (Heavy Trust Tax)
In 2012, U.S. retail giant Target analyzed purchasing patterns — prenatal vitamins, unscented skincare products, baby-related purchases, and other indicators — to predict pregnancy status. The company mailed baby-product coupons to a teenage girl before her family knew she was pregnant. Her father discovered the pregnancy through the coupons, and the story later appeared in The New York Times.
Target eventually adjusted its strategy. Instead of sending highly targeted baby-product mailers alone, it mixed them with unrelated promotions such as lawn mowers and barbecue grills so the recommendations would appear “less precise.”
The lesson here is not “do not use data.”
The lesson is this:
Once inference touches sensitive domains such as health, fertility, or financial status, even a correct algorithm can create a deeply wrong human experience.
Target’s solution — intentionally reducing recommendation precision — sounds absurd at first. Yet it acknowledged an uncomfortable truth:
In some categories, excessive accuracy is itself offensive.
An L4-level inference may achieve 99% accuracy, but the remaining 1% of misfires can still destroy trust.
Case 3: A Nordic DTC Brand’s “Transparency Experiment” (Mixed Outcome)
A skincare brand based in Stockholm tested a new checkout-page feature:
“We used your browsing history to recommend this product. Would you like to clear this preference?”
The result surprised the company.
Conversion rates did not decline. Instead, they increased by approximately 8%.
However, email unsubscribe rates also rose by 3%.
What does this mean?
Transparency filtered out customers who already distrusted the brand while strengthening loyalty among those who stayed.
This was not a perfect victory. It was a realistic trade-off.
The brand ultimately decided that the 3% loss was worthwhile because the lifetime value (LTV) of the remaining customers nearly doubled.
IV. The Practical Framework: Trust-Centric Personalization
Based on the research and case studies above, I developed a four-pillar framework.
It does not require abandoning personalization.
It only requires asking one question before adding another layer:
Can your business afford the trust tax?
Pillar 1: Transparency as a Feature
Do not bury explanations on page 47 of your privacy policy.
Answer “Why am I seeing this?” directly inside the user experience.
Academic research shows that:
Transparency is the single strongest predictor of trust (τ = 0.72, p < 0.01).
This is not a compliance expense. It is a strategic investment.
Practical Recommendation
Add a concise explanation beneath recommendation cards, marketing emails, or advertisements. Keep it under two sentences.
For example:
“Recommended because you viewed [specific product name].”
Not vague language such as:
“Based on your interests.”
Pillar 2: Consent as Onboarding
Treat personalization layers like optional packages.
By default, keep L3–L5 turned off and allow users to actively opt in — just as restaurants do not automatically add every topping to your meal.
CapTech’s research explicitly states that:
The key to moving consumers from distrust to loyalty is a transparent value exchange.
Practical Recommendation
During onboarding or account setup, offer users three levels of personalization:
- Basic Recommendations (L1–L2)
- Advanced Recommendations (L3)
- Full Personalization Features (L4–L5)
Most users will likely choose the basic level. However, users who voluntarily select advanced personalization typically show significantly higher conversion and retention rates because they feel in control.
Pillar 3: Value Reconciliation
Every quarter, provide users with a simple “data value report.”
Tell them:
“You shared X type of data, which helped save Y amount of time or discover Z relevant products.”
Make the implicit social exchange explicit.
According to Thales:
86% of consumers expect some form of data privacy rights, while 63% believe too much of the burden of protecting data falls on consumers themselves.
If you never explain the exchange, users will never recognize the value.
Practical Recommendation
You do not need complex dashboards or visualizations.
A simple email can work:
“Over the past three months, we used your browsing history to recommend 47 new products, three of which you added to your cart. If you would like to adjust your recommendation preferences, click here.”
Pillar 4: The Creepiness Audit
Establish internal red lines.
Any campaign based on inferred sensitive information should pass an “awkwardness test”:
“If this recommendation were sent to the CEO’s mother, would she feel uncomfortable or angry?”
Gartner analyst Brent Adamson described good personalization as “Tailored Help” — using the fewest possible data dimensions while balancing between “too inaccurate” and “too creepy.”
Practical Recommendation
Once per month, ask non-technical employees — customer support staff, legal personnel, interns — to experience your personalization journey as if they were customers.
If they raise an eyebrow, your customers are probably already leaving.
V. A 10-Question Self-Audit: How Much Trust Tax Is Your Brand Collecting?
Answer the following questions with Yes or No. It takes about two minutes.
- Can users find the option to disable personalized recommendations within three seconds?
- Does your recommendation system use cross-site tracking data (L3 or above)?
- Do you push content based on non-shopping behaviors such as social interactions, location, or voice activity?
- When users receive personalized content, can they clearly see why it was recommended?
- Does your team regularly test the “creepiness threshold” at least once per quarter?
- Have you ever shown users what value their data created?
- When your privacy policy changes, do users receive proactive notifications?
- Does your personalization include predictive inference such as “you may be pregnant” or “you may be planning to quit your job”?
- Can users download or delete all personal data your company stores?
- Do your KPIs include trust-related metrics rather than only conversion rates and click-through rates?
Scoring Guide
- 0–2 Yes Answers: Heavy-tax zone. Compounded churn risk may exceed 30%.
- 3–5 Yes Answers: Moderate trust burden. Significant optimization opportunities remain.
- 6–8 Yes Answers: Low-tax zone. Your trust assets are relatively healthy.
- 9–10 Yes Answers: Refund zone. Trust has become your competitive advantage.
Conclusion: Returning to Maya’s Story
What did Maya do afterward?
She disabled cross-site tracking layers (L3), added “Based on products you viewed” labels to recommendation cards, and sent long-term customers an annual “data value report.”
The result:
Personalized click-through rates dropped by 15%, but overall repurchase rates increased by 22%, while customer-support complaints declined by 40%.
Her explanation was simple:
“I lost a group of people who clicked but never intended to buy. What remained were the customers who genuinely trusted me.”
The best personalization is the kind customers would willingly explain to their friends.
Would your current personalization strategy pass the “friend test”?
References
- Gartner, Inc. (2019). Gartner Survey Shows Brands Risk Losing 38 Percent of Customers Because of Poor Marketing Personalization Efforts. Survey of 2,500+ customers.
https://www.gartner.com/en/newsroom/press-releases/2019-03-11-gartner-survey-shows-brands-risk-losing-38-percent-of - Gartner, Inc. (2025). Gartner Survey Reveals Personalization Can Triple the Likelihood of Customer Regret at Key Journey Points. Survey of 1,464 B2B buyers and consumers across North America, U.K., Australia, and New Zealand (Nov–Dec 2024).
https://www.gartner.com/en/newsroom/press-releases/2025-06-03-gartner-survey-reveals-personalization-can-triple-the-likelihood-of-customer-regret-at-key-journey-points - Thales. (2025). Thales 2025 Digital Trust Index – Consumer Edition. Conducted by Censuswide. 14,009 respondents across 14 countries (Australia, Brazil, Canada, France, Germany, India, Japan, Mexico, Netherlands, Singapore, Sweden, UAE, UK, USA).
https://cpl.thalesgroup.com/about-us/newsroom/digital-trust-index-2025 - CapTech Consulting. (2025). 2025 Consumer Survey: Solving the Personalization Paradox. 447 respondents across the United States (August 2025).
https://www.captechconsulting.com/articles/2025-consumer-survey-solving-the-personalization-paradox - Journal of Retailing. Mixed-method empirical study on AI-powered personalization and consumer trust. Study conducted among 400 active online shoppers from Amazon, Flipkart, and Alibaba using stratified random sampling (95% confidence level, ±5% margin of error).
About the Author
Henry Lawson is an independent analyst and writer focused on artificial intelligence, consumer behavior, and digital commerce. He studies how recommendation algorithms, personalization systems, AI assistants, and online platforms influence the way people discover products, evaluate information, and make purchasing decisions.
Disclaimer
The information provided in this article is for general informational and educational purposes only and should not be interpreted as legal, cybersecurity, compliance, or financial advice.